Mortality rates

‘The death rate among the enslaved on the plantations was so high – in the eighteenth century about 5 percent – that new people had to be brought in from Africa all the time.’ (Fatah-Black, 2018: 11, translation NM)
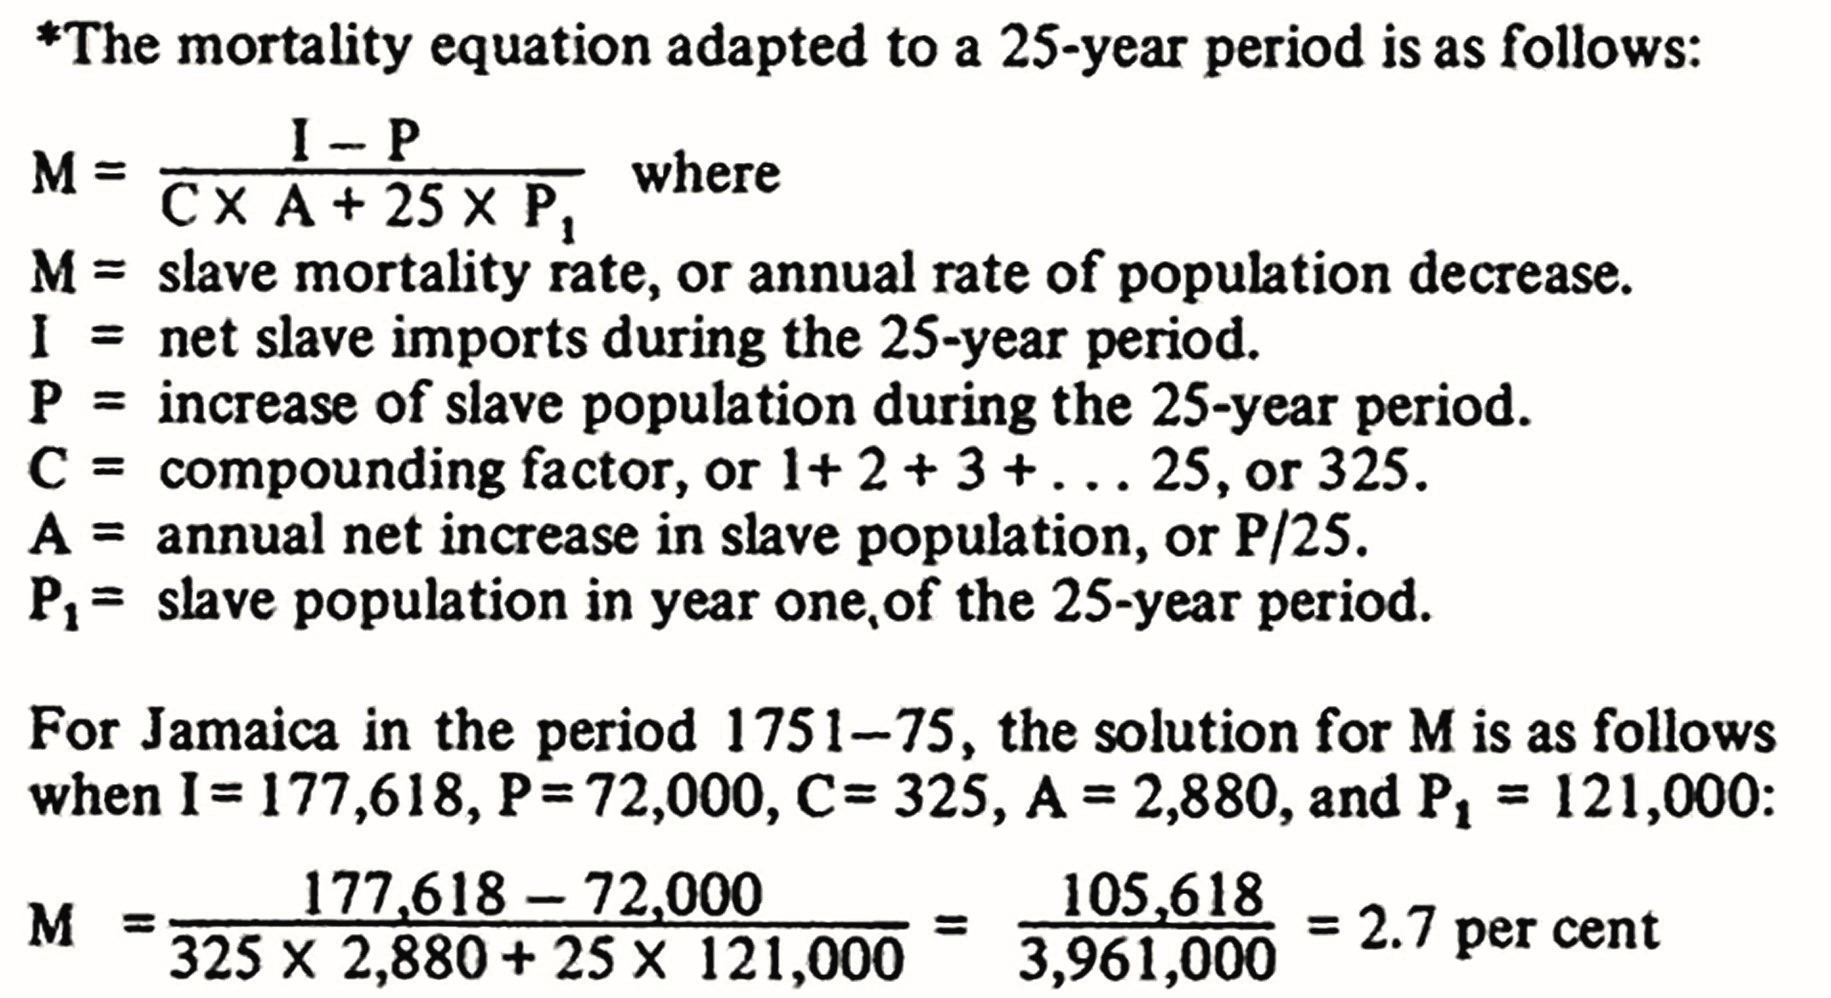
Fatah-Black here refers to the work of Van Stipriaan, who in turn referred to Nepveu, Blom and Stedman, explaining how he came to the number of 5%. A year after Van Stipriaan, Beeldsnijder presented death rates for the period 1720 to 1752. (1994: 209) Based on a formula that was developed in the seventies of the twentieth century by Sheridan and co-workers (1972: 29) Beeldsnijder was able to present this overview for said period:

When his book ‘Sugar and Slavery’ was reprinted in 2000 (first published 1974) Sheridan felt no inclination or need to alter or adjust the formula. We have applied this formula to the period of 1693 to 1733 so death estimates could be added to the database. Sheridan stated: ‘The data needed for computing the mortality rate are net slave imports, that is total imports less re-exports, and the slave population at selected intervals of time.’(2000: 245-6) This is the formula used:
To establish factor ‘I – net slave imports’ the Trans Atlantic Slave Trade Database 2016 (TASTDB) has been consulted. Factor P has been established with the help of the corrected data in the GLdH-database. The death rates we arrived at are the result of the application of the formula to 5-year as well as 25-year intervals. The factor ‘less re-exports’ has been set aside for these calculations, as the TASTDB provides very precise information on how many enslaved people arrived and stayed in Suriname.
We arrived at an average yearly death rate of 5.61% for the period 1693-1733. Within that rate we have taken into account that the numbers we worked with were supplied by plantation owners. The enslaved that had fled from their plantations would not have been included in their annual tax report. Therefore a separate factor for so called ‘wegloopers’ (runaways) had to be calculated as well.
The ‘wegloopers’ factor

The enslaved that fled the plantations were not a part of the population as presented by the GLdH. Based on his own research Van Stipriaan established that the death rates in historical sources were quite correct but did not take into account the runaway enslaved. He stated that ‘[..] on average 2,5 per 1000 had to be subtracted to account for marronage.’ (1993: 316, translation NM)
Based on the work of Frank Dragtenstein, who focussed his PhD thesis on the runaways, for the period 1693-1733 a slightly higher rate pro mille could be determined. In the introduction to his seminal study into ‘wegloopers’ Dragtenstein presented a set of numbers for a wider period in the same era, which we have used for the calculations:
- 1678 – 800 runaway enslaved
- 1702 – 1250 to 1500 runaway enslaved
- 1749 – 3000 runaway enslaved (2002: 11-2)
The average increase of runaway enslaved people between 1678 and 1749 then was 31 a year. Taking that as a starting point, the number for 1702 is closer to 1500 than 1250. For the period 1693 to 1733 we see an increase of 1240, which results in an addition of 3 enslaved pro mille on the annual totals presented by the GLdH. As such the factor has been applied in the death rate estimate calculations.